


1. Silk products trade situation in July
According to statistics from the United States Department of Commerce, the trade value of silk products in July was 385 million US dollars, dropping 2.96% from the previous month and increasing 24.03% from the same period last year. Among them, the import value was 333 million US dollars, falling 2.16% month-on-month and rising 19.93% year-on-year; the export value was 52.386 million US dollars, with a decrease of 7.78% on a monthly basis and a rise of 58.54% from the year earlier. The specific product composition was as follows:
Import: The amount of silk filament was 1.5029 million US dollars, up by 88.89% month-on-month and 90.69% YOY, with whose quantity surging 434.71% from the previous month to 62.73 tons and jumping 46.79% from the year earlier; the amount of silk fabrics was 19.825 million US dollars, decreasing 22.43% and increasing 4.49% from the previous month and year respectively; The amount of silk madeups was 312 million US dollars, down by 0.74% from the previous month and up by 20.85% YOY.
Export: The amount of silk filament was 64.1 thousand US dollars, dropping 12.27% month-on-month and 8.87% YOY, with whose quantity surging 1746.11% month-on-month and increasing 162.2% YOY to 28.02 tons; the amount of silk fabrics was 15.47 million US dollars, dropping 9.29% and growing 44.66% from the previous month and year respectively; The amount of silk madeups was 36.8518 million US dollars, down by 7.12% month-on-month and up by 65.42% YOY.
2. Silk products trade from January to July
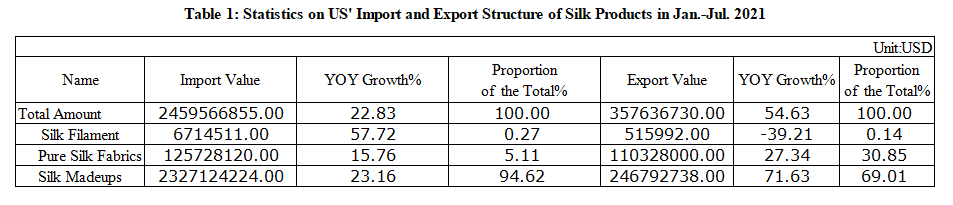
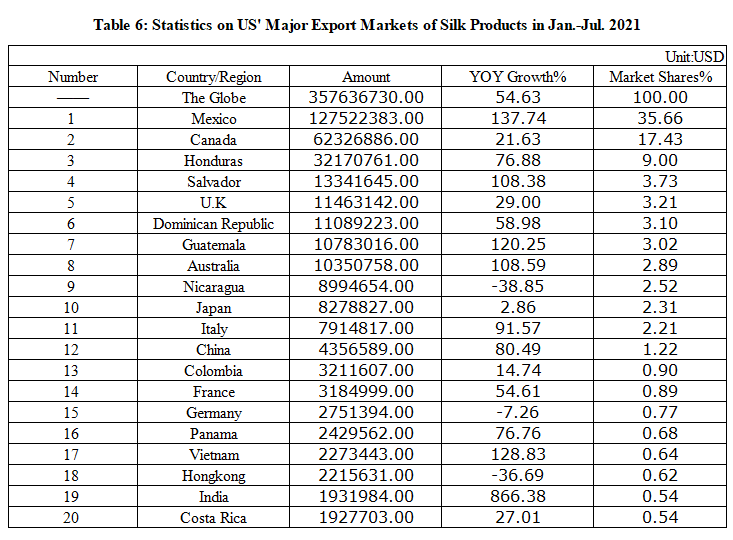
From January to July, the trade value of US’ silk totaled 2.817 billion US dollars, a year-on-year increase of 26.12%. Among them, the import value was 2.46 billion US dollars, up 22.83% YOY; the export value was 358 million US dollars, up 54.63% YOY(the same below). Details were as follows:
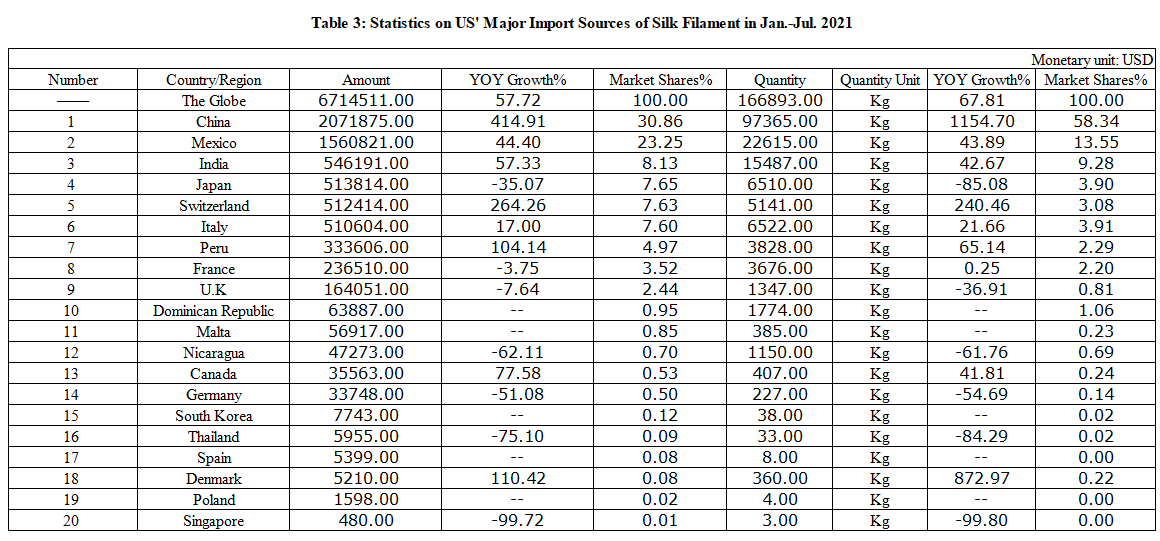
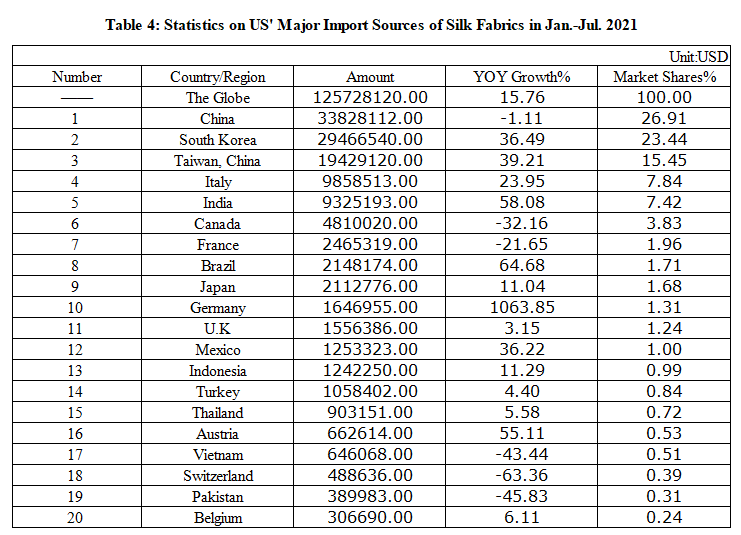
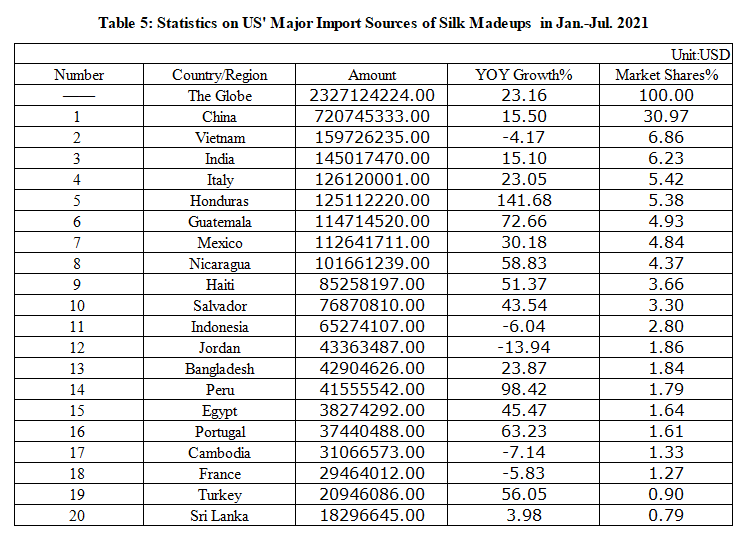
The composition of the imported products: silk filament amounted to 6.7145 million US dollars, climbing 57.72%, with whose quantity growing 67.81% to 166.89 tons; silk fabrics amounted to 126 million US dollars with a rise of 15.76%; Silk madeups amounted to 2.327 billion US dollars, an increase of 23.16%.
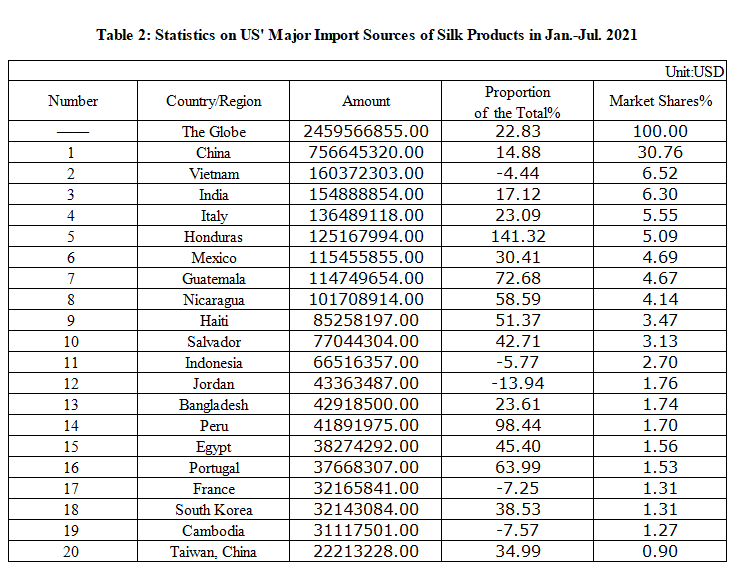
The major sources of imports: China (757 million US dollars, up 14.88%, accounting for 30.76%), Vietnam (160 million US dollars, down 4.44%, accounting for 6.52%), India (155 million US dollars, up 17.12%, accounting for 6.3%), Italy (136 million US dollars, up 23.09%, accounting for 5.55%), Honduras (125 million US dollars, up 141.32%, accounting for 5.09%). The total proportion of the 5 sources above was 54.22%.
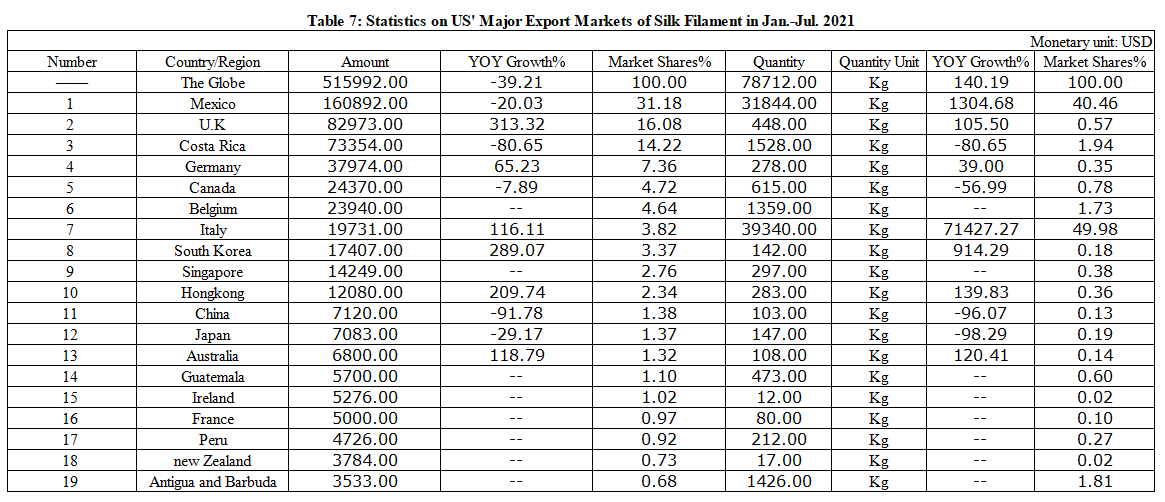
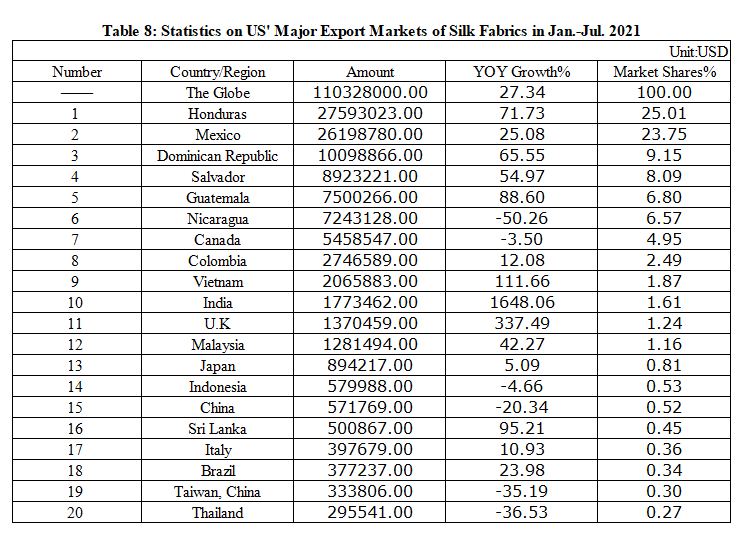
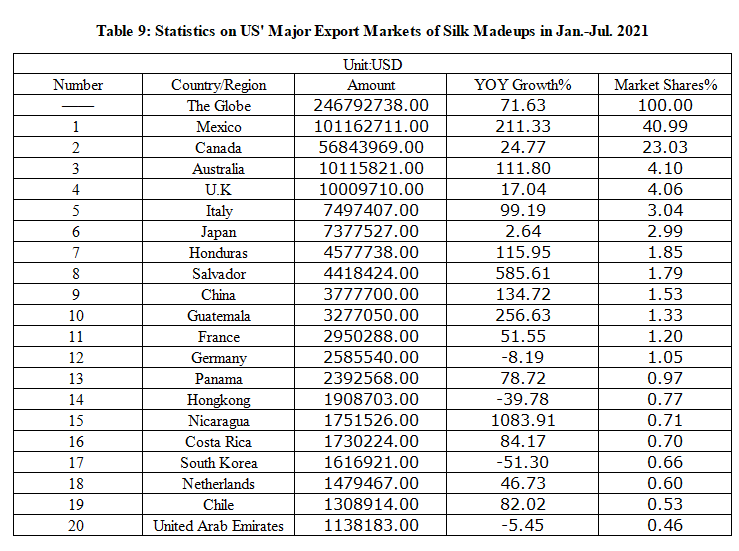
The composition of the export products: silk filament amounted to 516 thousand US dollars, a year-on-year decrease of 39.21%, with whose quantity up 140.19% to 78.71 tons; silk fabrics amounted to 110 million US dollars, up 27.34%; and silk madeups were 247 million US dollars, an increase of 71.63% .
The major export markets were Mexico (128 million US dollars, up 137.74%, accounting for 35.66%), Canada (62.3269 million US dollars, up 21.63%, accounting for 17.43%), Honduras (32.1708 million US dollars, up 76.88%, accounting for 9%), Salvador (13.3416 million US dollars, up 108.38%, accounting for 3.73%), the United Kingdom (11.4631 million US dollars, up 29%, accounting for 3.21%). The five markets above accounted for 69.03% of the total.
Table Directory:
Table 1: Statistics on US' Import and Export Structure of Silk Products in Jan.-Jul. 2021
Table 2: Statistics on US' Major Import Sources of Silk Products in Jan.-Jul. 2021
Table 3: Statistics on US' Major Import Sources of Silk Filament in Jan.-Jul. 2021
Table 4: Statistics on US' Major Import Sources of Silk Fabrics in Jan.-Jul. 2021
Table 5: Statistics on US' Major Import Sources of Silk Madeups in Jan.-Jul. 2021
Table 6: Statistics on US' Major Export Markets of Silk Products in Jan.-Jul. 2021
Table 7: Statistics on US' Major Export Markets of Silk Filament in Jan.-Jul. 2021
Table 8: Statistics on US' Major Export Markets of Silk Fabrics in Jan.-Jul. 2021
Table 9: Statistics on US' Major Export Markets of Silk Madeups in Jan.-Jul. 2021
The original Chinese edition is from CCCT, translated and edited by esilk. net.

