


1. The import and export situation of silk products in May
According to China Customs statistics, the total import and export value of silk products was 183 million US dollars (the same below) of China, a year-on-year increase of 44.53%. Among them, the export value was 161 million dollars, rising 26.99% and 71.67% from the previous month and year respectively; the import value was 22 million dollars, falling 20.03% and 33.61% from the previous month and year respectively. The specific details were as follows:
From January to May, the total import and export value of silk products was 815 million dollars, up 26.37%, accounting for 0.59% of China’s total textile and apparel imports and exports.
2.1 Export situation
The export value of pure silk products was 670 million US dollars , a year-on-year increase of 40.58%, accounting for 0.54% of China's textile and apparel exports. During the same period, the export value of textile and apparel increased by 16%.
2.1.1 Export product structure
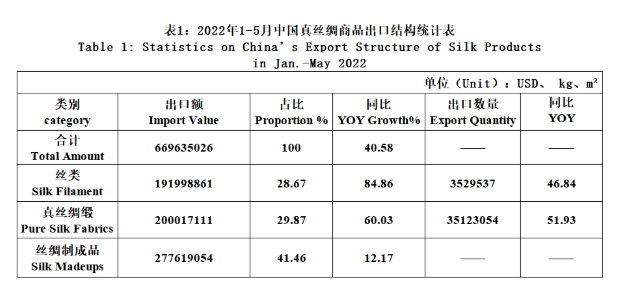
From January to May, the exports of the three categories had risen in different degrees, in which the export growth of silk filament and silk fabrics expanded over 50%, that is mainly due to last year’s low base and the export value in the first five months of this year had not yet reached the level of the same period in 2019. From January to May, the export value of silk filament was 192 million dollars, jumping 84.86%, accounting for 28.67%, and the quantity of which was 3529.54 tons, growing 46.84%, with its export unit price of 54.4 dollars/kilo, up 25.97%; silk fabrics amounted to 200 million dollars, growing 60.03%, accounting for 29.87%, with its export unit price of 5.69 dollars/meter, growing 5.18%; the exports of silk madeups totaled 278 million dollars, growing 12.17%, accounting for 41.46%.
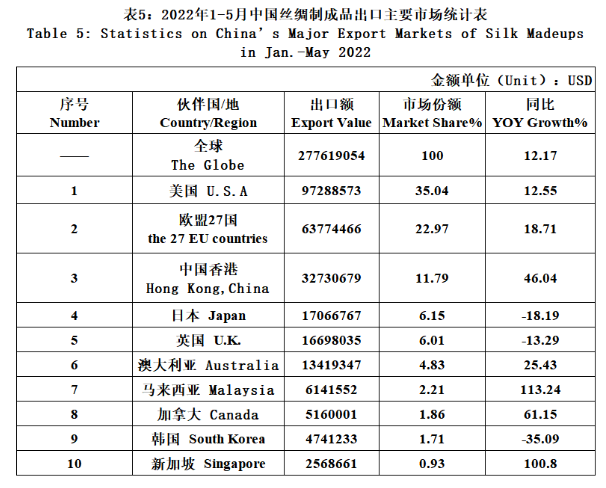
2.1.2 Major export markets
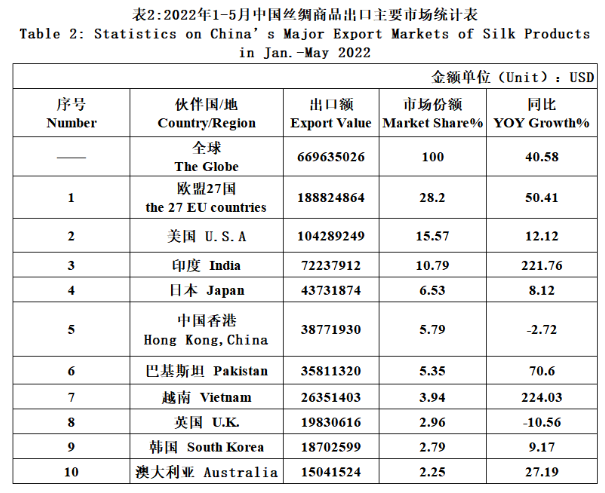
The export of silk products to the Indian and Vietnamese markets increased significantly, with an increase of more than 220%, to the European Union and Pakistan markets increased by a larger year-on-year rate, 50% and 70% respectively, and to the United States and Japanese markets increased less than the overall growth rate of silk product exports. Compared with the same period last year, the market share of the 27 EU countries increased by 2%, and the United States fell by 4%.
1) Export situation of Silk filament
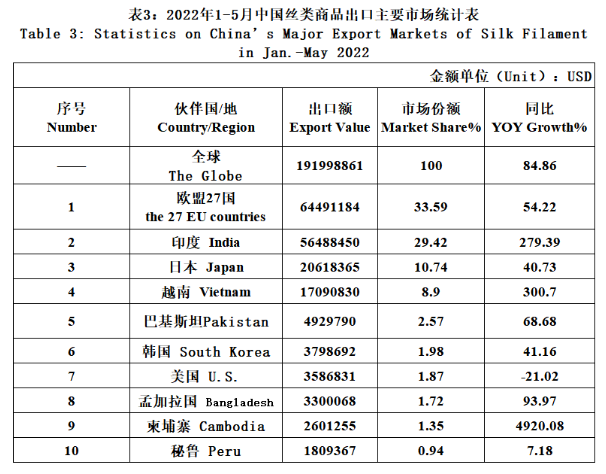
Among the top ten major markets for silk filament exports, in addition to the negative growth of exports to the United States, others had different degrees of growth, of which India, Vietnam, Bangladesh and Cambodia increased more than the overall growth rate of silk exports. India’s market share increased by 15%, while the share of the European Union and Japan fell by 7% and 3% respectively.
2) Export situation of Silk fabrics
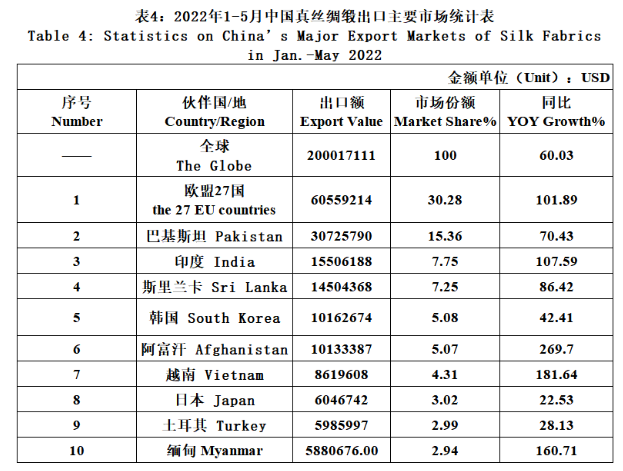
Silk fabrics increased to varying degrees in the top ten export markets, doubling to the European Union and Indian markets, and soaring greatly to Afghanistan, Vietnam and Myanmar. Compared with the same period last year, the EU’s market share increased by 6%, Pakistan’s fell slightly, and India’s and Sri Lanka’s share increased by 1-2%.
3) Export situation of silk madeups
From January to May, the export of silk madeups to Japan, the United Kingdom and South Korea declined, and to other major markets increased by different margins, among which the growth rate of the largest export market the United States was basically the same as the whole, and Malaysia and Singapore rose by more than 100%. The market share of the United States was basically the same as that of the same period last year, the market share of the European Union and Hong Kong increased, but it did not exceed 3%, and the share of Japan fell by 2%.
2.1.3 Export situation of provinces and municipalities
The main export provinces and municipalities of silk products generally increased, among which Hunan, Guangxi and Liaoning increased greatly, and Zhejiang, Guangdong and Sichuan increased more than the overall growth rate of the whole country. Zhejiang’s export share of silk products increased by 3%, Jiangsu, Guangdong and Shandong was basically the same as the same period last year, and Sichuan and Hunan increased by 1-2%.
2.2 Import situation
From January to May, the import value of silk products was 145 million dollars, down 13.82% year-on-year, accounting for 1.06% of textiles and apparel. In the same period, the import value of textiles and apparel fell by 8.62% year-on-year.
2.2.1 Import structure
In addition to the silk filament showed an increase, the imports of silk fabrics and silk madeups decreased sharply. The import value of silk filament was 23.6722 million dollars, rising 6.91%, accounting for 16.32%, the quantity of which amounted to 2278.18 tons, dropping 12.2%, and the unit price of which jumped by 21.81% to 10.39 dollars/kilo; the import of pure silk fabrics was 6.553 million dollars, decreasing 15.95%, accounting for 4.52%, and the unit price of which jumped 23.67% to 15.52 dollars/meter; imports of silk madeups fell 17.02% to 115 million dollars, accounting for 79.16%.
2.2.2 Import situation of sources
China’s silk products imported from North Korea showed net growth year-on-year, from Morocco increased by nearly 350%, from Myanmar surged, and from the European Union, Japan and other countries or regions declined to varying degrees. The EU was the most important source of silk imports in China, accounting for nearly 3/4, but its share fell by nearly 4% from January to May this year compared with the same period last year.
2.2.3 Import situation of provinces and municipalities
From January to May, among the provinces and municipalities that imported silk products in China, Liaoning grew sharply ranking third and Yunnan showed net growth ranking fifth, Fujian increased by 26%, and the rest declined to varying degrees. Shanghai was the main force in China’s silk imports, accounting for 3/4 of the total import share, which was nearly 3% lower than the same period last year.
Source: The Chinese edition is from CCCT, translated and edited by esilk. net.

