


1.Silk product trade in July
According to statistics from Eurostat, the trade value of silk products in July was 884 million US dollars, dropping 14.08% from the previous month and 1.29% from the same period last year. Among them, the import value was 486 million US dollars, down 11.95% month-on-month and up 9.9% year-on-year; the export value was 398 million US dollars, falling 16.53% on a monthly basis and 12.2% from the year earlier. Details were as follows:
Import: The amount of silk filament was 20.7127 million US dollars, growing 30.82% month-on-month and 52.11% YOY, with its quantity jumping 19.91% from the previous month and 23.7% from the year earlier to 344.196 tons; the amount of silk fabrics was 59.1806 million US dollars, falling 14.51% and climbing 2.47% from the previous month and year respectively; The amount of silk madeups was 406 million US dollars, down by 13.03% from the previous month and up by 9.51% YOY.
Export: The amount of silk filament was 1.0785 million US dollars, falling 32.55% month-on-month and 27.59% YOY, with its quantity dropping 60.77% month-on-month and 30.56% YOY to 17.446 tons; the amount of silk fabrics was 63.9565 million US dollars, going down 10.62% and 7.51% from the previous month and year respectively; The amount of silk madeups was 333 million US dollars, dropping 17.52% month-on-month and 12.99% YOY.
2. Silk product trade from January to July
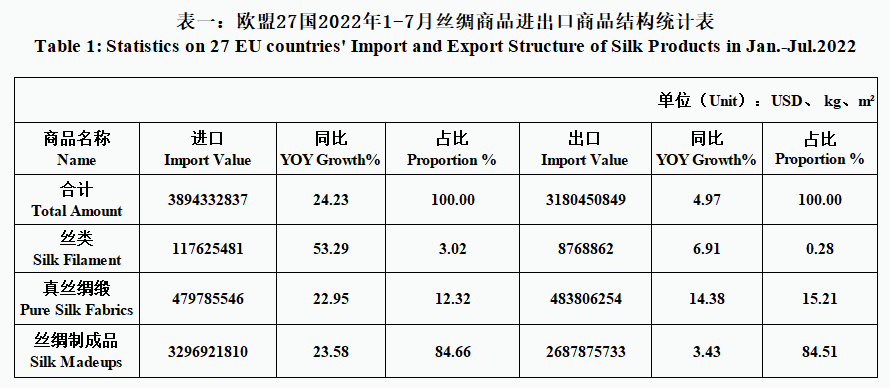
From January to July, the EU’s silk trade value totaled 7075 million US dollars, a year-on-year increase of 14.76%. Among them, the import value was 3894 million US dollars, up 24.23% YOY; the export value was 3180 million US dollars, up 4.97% YOY(the same below). Details were as follows:
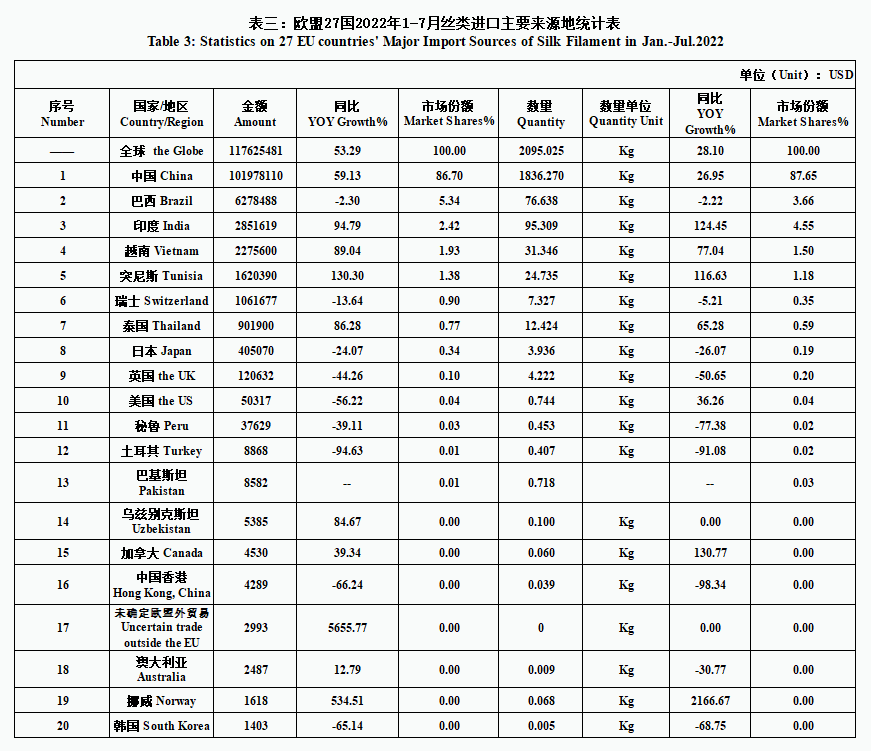
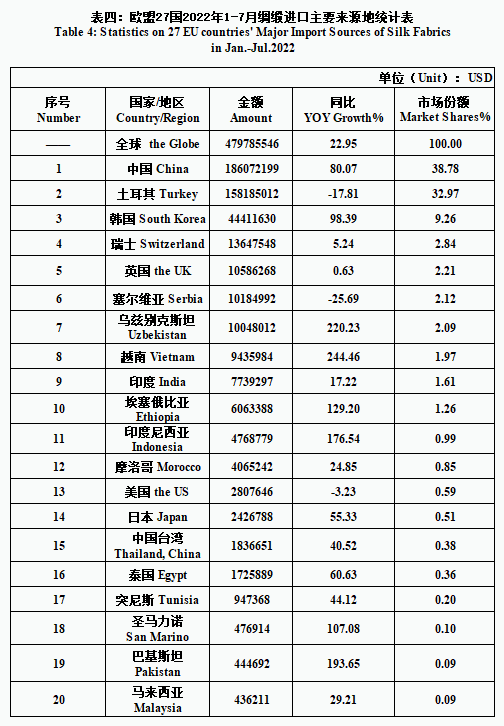
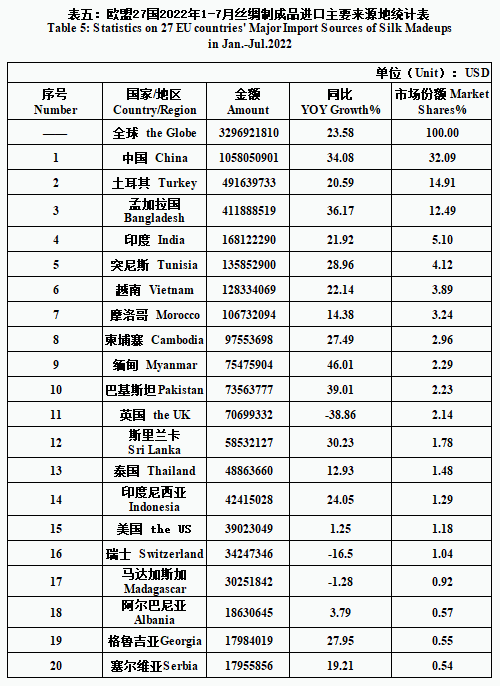
Among the imported products, silk filament amounted to 1180 million US dollars, growing 53.29%, with its quantity jumping 28.1% to 2095.025 tons; silk fabrics amounted to 480 million US dollars, with a rise of 22.95%; Silk madeups amounted to 3297 million US dollars, up 23.58% .
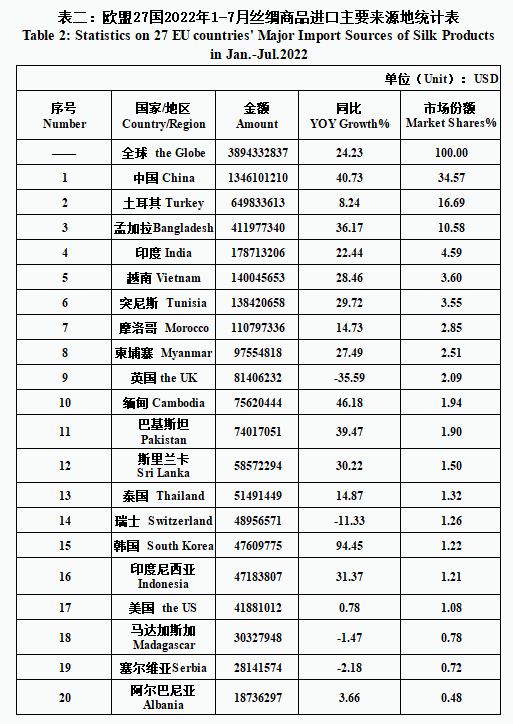
The major sources of imports were China (1346 million US dollars, up 40.73%, accounting for 34.57%), Turkey (650 million US dollars, up 8.24%, accounting for 16.69%), Bangladesh (412 million US dollars, up 36.17% , accounting for 10.58%), India (179 million US dollars, up 22.44%, accounting for 4.59%), Vietnam (140 million US dollars, up 28.46%, accounting for 3.6%). The total proportion of the 5 sources above was 70.03%.
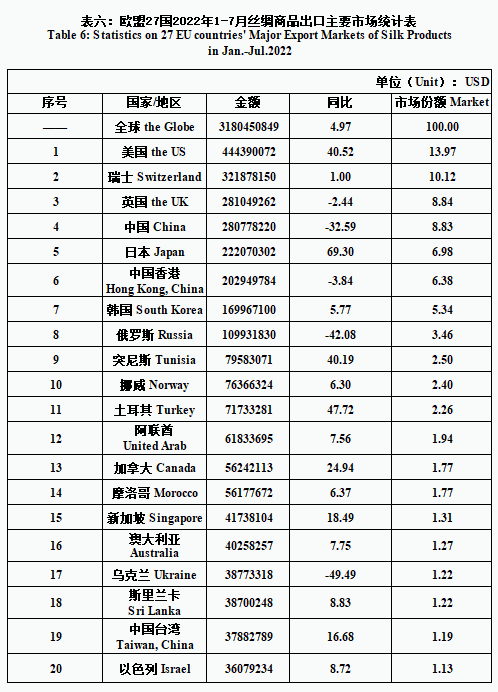
Among the export products, silk filament amounted to 8.7689 million US dollars, a year-on-year increase of 6.91%, with the quantity jumping 14.07% to 198.265 tons; silk fabrics amounted to 484 million US dollars, up 14.38% YOY; silk madeups amounted to 2688 million US dollars, an increase of 3.43% YOY.
The major export markets were the US (444 million US dollars, up 40.52%, accounting for 13.97%), Switzerland 322 million US dollars, up 1%, accounting for 10.12%), the UK (281 million US dollars, down 2.44%, accounting for 8.84%), China (281 million US dollars, down 32.59%, accounting for 8.83%), Japan (222 million US dollars, up 69.3%, accounting for 6.98%). The five markets above accounted for 48.74% of the total.
The original Chinese edition is from CCCT, translated and edited by esilk. net.

